Maryland's Business Environment
A state’s business environment is comprised of the policy and locational attributes that impact business operations. There is no uniform list of factors that make up or influence a state’s business climate, but there is broad agreement that key policy issues (state tax and regulatory) and locational issues (market size, location, infrastructure, and quality of life) are the key factors considered by businesses when making a business location choice.
While firms’ overall perception of Maryland’s business climate is described above, the Jacob France Institute asked firms to rate Maryland’s competitiveness in five key areas that impact a state’s business climate: taxes, regulations, infrastructure, labor markets, and quality of life.
Overall, Maryland businesses have a less-favorable view of Maryland’s tax and regulatory climate than its infrastructure and labor market assets. Firms were first asked to rate Maryland’s competitiveness in taxes, regulations, infrastructure, and labor markets to neighboring states. The result are as follows:
-
More Maryland businesses have a negative view of Maryland’s tax climate than a positive view, with 41% of responding firms viewing Maryland’s tax climate as somewhat or very uncompetitive and only 34% viewing it as somewhat or very competitive.
-
Maryland businesses are split on their view of Maryland’s regulatory climate, with 30% viewing it as competitive and 30% viewing it as uncompetitive compared to neighboring states.
-
Firms have a more strongly positive view of Maryland’s infrastructure assets, with 45% viewing it as competitive and only 17% as uncompetitive, and labor market assets, with 45% viewing it as competitive and only 16% as uncompetitive.
-
Perceptions of Maryland’s tax and regulatory climate have improved since 2011, with:
-
Perceptions of Maryland’s tax climate improving from 28% competitive and 50% noncompetitive in 2011 to 34% competitive and 41% uncompetitive in 2019
-
Perceptions of Maryland’s regulatory climate improving from 28% competitive and 38% noncompetitive in 2011 to 30% competitive and 30% uncompetitive in 2019
-
Perceptions of Maryland’s infrastructure and labor market competitiveness worsened slightly since 2011
-
Firms were asked more detailed questions on taxes, regulations, labor force, infrastructure, and quality of life issues and their impact on Maryland’s business environment.
Table 11: How would you compare Maryland business taxes to neighboring states? (Q33-1)
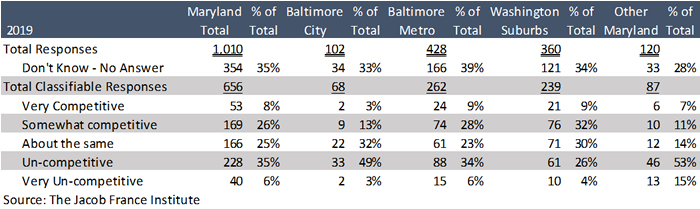
Table 12: How would you compare Maryland’s overall regulations to neighboring states? (Q33-2)
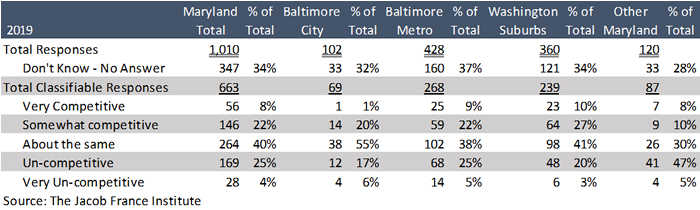
Table 13: How would you compare Maryland Infrastructure to neighboring states? (Q33-3)
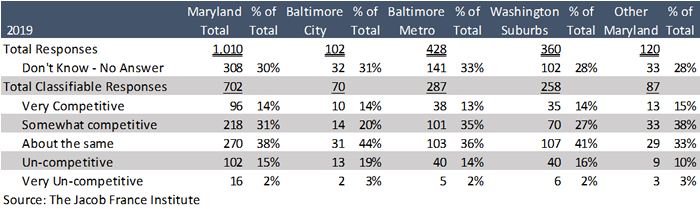
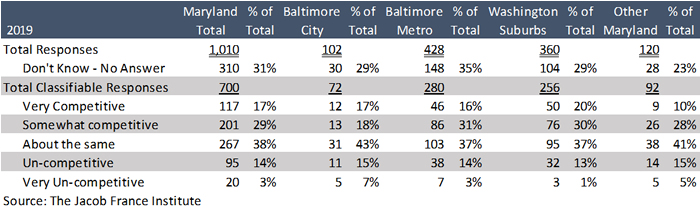
Table 14: How would you compare Maryland Labor Markets to neighboring states? (Q33-4)
Taxes
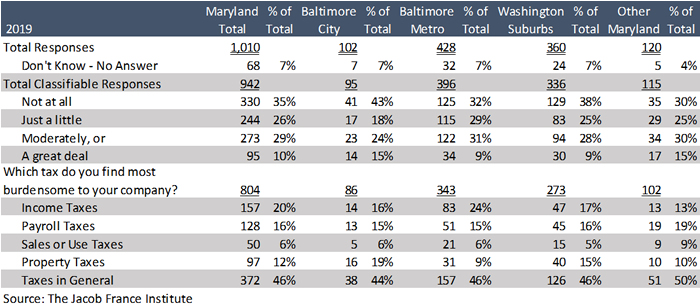
Firms were asked to rate the extent to which state or local taxes hindered their ability to meet their strategic goals. Overall, 65% of businesses reported being negatively impacted by Maryland state or local taxes, down slightly from 67% of responding firms in 2011. When asked which taxes were most burdensome, nearly half (46%) reported taxes in general, 20% income taxes, 16% payroll taxes, and 12% property taxes.
Table 15: To what extent have state or local taxes hindered the ability of your business to meet its strategic goals? (Q30)
Regulations
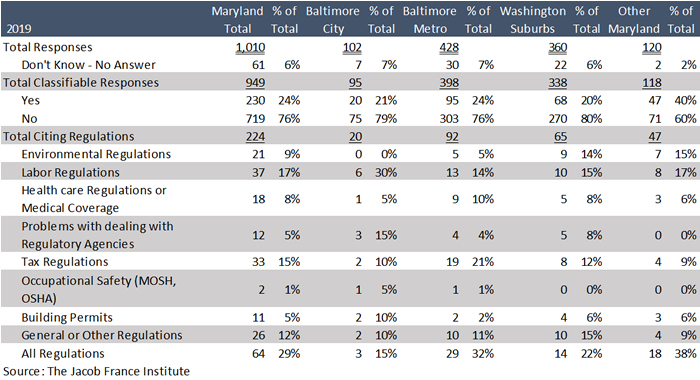
Firms were asked to rate the extent to which state regulations hindered their ability to meet their strategic goals. Overall, only 24% of businesses report being negatively impacted by Maryland state regulations, down from 36% of responding firms in 2011. When asked which state regulations were most burdensome, most responded regulations in general or all regulations, at 41% combined, with 17% reporting labor Regulations and 15% tax regulations.
Table 16: Have regulations enacted by Maryland state government hindered the
ability of your business to meet its strategic goals? (Q28)
Labor Market
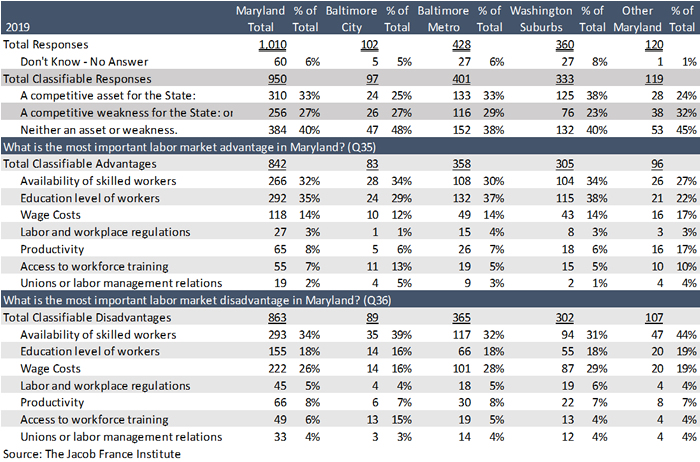
Firms were asked to characterize overall labor market conditions in Maryland and identify the state’s labor market advantages and disadvantages. Overall, more firms viewed local labor markets as a competitive asset for the state (33%) than a weakness (27%). When asked to identify the core labor market advantages and disadvantages in Maryland:
-
The education level of workers was cited as an advantage by 35% of firms and as a disadvantage by 18%.
-
The availability of skilled workers was cited as an advantage by 32% of firms and a disadvantage by 34%.
-
Wage costs was cited as an advantage by 14% of firms and as a disadvantage by 26%.
Labor market issues appeared to become a key issue for Maryland businesses, with 33% of firms reporting that the state labor market is an economic development asset below 37% of firms in 2018 and 39% in 2011, and with more firms in 2019 viewing the availability of skilled workers as a disadvantage than an advantage.
Table 17: How would you characterize overall labor market conditions in Maryland?
Maryland Labor Market Advantages and Disadvantages (Q34-35-36)
Infrastructure
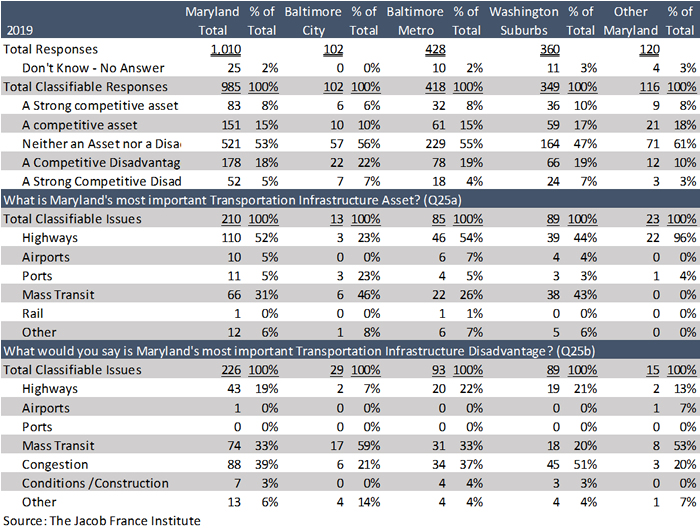
Firms were asked to describe the impact of Maryland’s transportation infrastructure on their business, were split on their view of the state’s transportation infrastructure. Twenty-four percent of Maryland businesses viewed the state’s transportation infrastructure as a competitive asset and 23% viewed it as a competitive disadvantage. Maryland’s highway infrastructure and mass transit system were considered the most import transportation assets by firms with a positive view of the state’s transportation infrastructure. Businesses with a negative view of Maryland’s transportation infrastructure saw congestion and lack of access to mass transit as the chief problems.
Table 18: How would you rank Maryland's transportation infrastructure in terms of its
impact on your business? (Q25)
Quality of Life
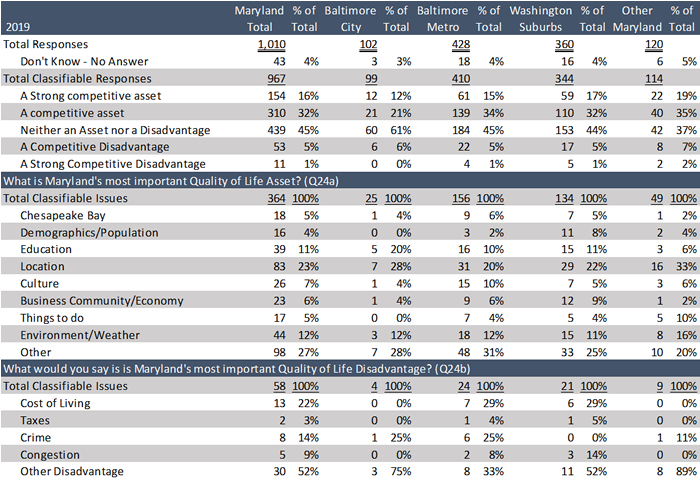
Firms were asked to rank the state’s quality of life as either an asset or a disadvantage, and to identify the greatest quality of life asset and the greatest quality of life disadvantage in Maryland.
-
Forty-eight percent of responding businesses rated Maryland’s quality of life as either a strong competitive asset or a competitive asset.
-
Among firms with a positive view of Maryland’s quality of life, the most frequently cited asset was Maryland’s location (23%) followed by the environment/weather (12%), and the state’s education system (11%).
-
Among firms with a negative view of Maryland’s quality of life, the most frequently cited disadvantage was the cost of living (22%) followed by crime (14%).
Table 19: How would you rank Maryland's quality of life in terms of its impact on your business? (Q24)